

This example shows how to improve the defined inventory policies using the Safety Stock Estimation experiment. Also, we will see how milk runs can be configured for a SIM model: the order in which the products will be delivered to customers from each facility.
For a better understanding of this scenario and its structure you can watch a demo video of this example
This example is a part of a sequence of scenarios:
- GFA Cold Chain — a scenario for finding warehouse locations using Greenfield Analysis.
- GFA Cold Chain (Multi-Echelon) — a scenario for finding a location of the main distribution center based on warehouse locations.
- SIM Cold Chain (Safety Stock Estimation) — a scenario for adjusting inventory policies to decrease carrying cost and improve Service level.
- SIM Cold Chain (Risk Analysis) — a scenario for testing the supply chain, constructed in previous steps in case of unpredicted events occurring.
All the input data is observed in the first step of this sequence. In the previous step, we found the location for the main distribution center, which receives products from the supplier and delivers them to the regional warehouses.
To prepare the scenario for this example we converted the GFA experiment result from the previous step into SIM scenario and specified more details to the supply chain.
- Added three suppliers for the products, which will be shipping products to the main distribution center. Each of the suppliers is a source for the Product Group of three different products.
- Added different vehicle types with different capacities for every echelon of the supply chain. Also, we specified the number of vehicles assigned to every regional distribution center in the Fleets table.
- Defined Carrying, Facility and Other costs for distribution center and regional distribution centers in the Facility Expenses table.
- Changed demand values to the uniform distribution, with min and max values defined as a neighbor of the initially defined value.
- Defined Processing Time (time for loading and unloading products, etc.) for regional distribution centers and customers.
- Generated milk runs for regional distribution centers to allow the vehicles to serve customers in a certain order. That way trucks will be allowed to fetch orders for several destination points and follow the route, visiting customers per the specified order. Once the final destination point of the milk run has been served or all loaded products are delivered, the vehicle will head to the positioning regional site.
Run a Simulation experiment and analyze results. Pay attention to Service Level and Available Inventory tabs.
Improve Service Level using Safety Stock Estimation experiment.
By running the Simulation experiment we can see collected statistics on the dashboard.
In the Service level tab, we can see that there is some problem in the supply chain that is resulting in an insufficient service level. On the Available Inventory Including Backlog chart from the Available inventory tab, we can see that in certain periods we were receiving orders but there were no available products to ship to customers (negative values of this chart). We are suggesting that this lack of products causes the insufficient service level.
Since there are periods with shortage of products in the distribution centers' storages, we need to improve Inventory policies for distribution centers. The easiest way is to run the Safety Stock Estimation experiment and convert its result into a SIM scenario.
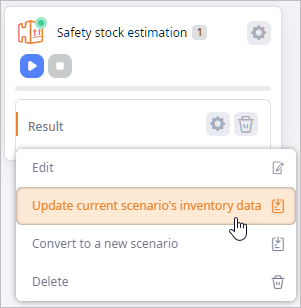
After updating scenario data with the received results, you will see that all the previous records in the Inventory table are now excluded from the scenario. The table also now contains new records with the data that has been generated based on the result of the Safety Stock experiment.
Now, if we run a Simulation experiment for these newly defined inventories, we can check how the service level improves. In addition, we can check the Available Inventory Including Backlog chart, which shows that only a small part of the products is in the backlog. This value is acceptable for this supply chain.
In the next step of this sequence (SIM Cold Chain (Risk Analysis)) we will check the performance of the supply chain in case of the influence of disruptive events
-
How can we improve this article?
-