

In this example, we will learn how to find locations for distribution centers by selecting service distance as the main criterion.
This scenario is the first step of the sequence of 4 example models that illustrate the different stages of supply chain analysis:
- GFA US Distribution Network — a scenario for finding locations for warehouses. This is the scenario we will investigate now.
- NO US Distribution Network — a scenario for selecting facilities from the suggested list of distribution centers and ports.
- SIM Distribution Network Analysis — a scenario that is based on the result of the optimization. This result has been converted to the SIM scenario to analyze the suggested network in more detail.
- SIM Budget Comparison — a scenario for analyzing the impact of unstable demand on the service level of the supply chain.
We plan to start selling home and garden products in the USA.
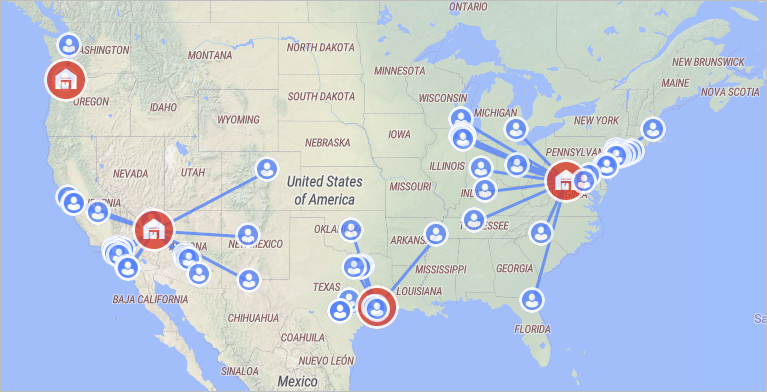
We will consider a supply chain with 70 customers on the territory of the United States.
The supply chain deals with five products: lighting, large home appliances, furniture, gardening equipment, and small appliances.
Demand is periodic, i.e., certain volume of products is ordered every 5 days:
- 16 customers order 16 pieces of furniture
- 18 customers order 4 gardening equipment
- 18 customers order 12 large home appliances
- 15 customers order 8 lightings
- 17 customers order 20 small appliances
Find locations for the regional distribution centers.
The ordered products must be delivered to customers within 2 days, which means the customers should be located within the range of 1000 km from the facilities.
Let us run the GFA experiment with the Service distance parameter set to 1000 km in the settings of the experiment.
The result of the experiment with the optimal distribution centers locations is available in the New Site Locations. The offered locations for distributional centers are Nevada, Oregon, Texas, and Virginia.
The data on product flows, distance coverage by demand and demand coverage by distance is given in the corresponding tables:
- Product Flows — shows detailed statistics on the flows of the supply chain within the specified period.
- Distance Coverage by Demand — shows detailed statistics on the distance to cover to satisfy a certain percentage of the demand.
- Demand Coverage by Distance (and total demand) — shows detailed statistics on the demand to satisfy within a certain distance per site created by the GFA experiment.
The next step is NO US Distribution Network, in which we convert the results of the GFA experiment to the NO scenario, define additional data, and perform Network Optimization experiment to select facilities from the suggested list.
-
How can we improve this article?
-