

In this phase we will obtain the input data and observe the service level. You may use your own input data as the basis for our experiment, or you may fetch and import our scenario.
Either way, you should have a supply chain model containing the following parameters:
- Customers with demand
- Distribution centers with limited inventory policies
- Supplier, replenishing inventory of the distribution centers
The numbered lists in tutorials are actually checklists. Click the numbers to save your progress!
Download and import the scenario
- Fetch the scenario. No internet connection is required, since the scenario is supplied with anyLogistix.
- Import the downloaded scenario. The GIS map will appear showing the content of the imported scenario.
- Explore the connections by clicking the
 Show connections button.
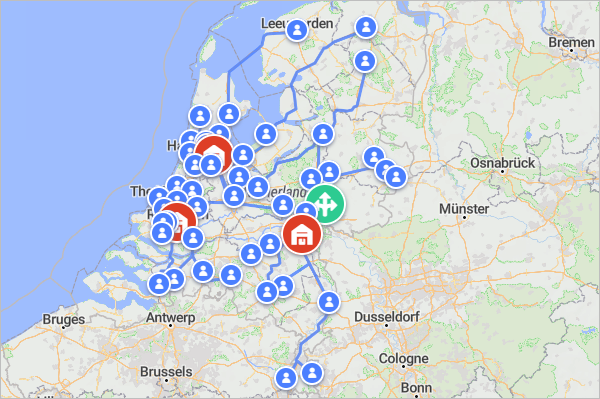
The imported scenario contains a supply chain with 50 customers in the largest cities of the Netherlands, 3 distribution centers, and the Royal Gazelle bicycle factory, as the supplier.
Let us run the Simulation experiment and observe the gathered statistics.
Run the Simulation experiment and examine the result
-
In the experiments section click the Simulation experiment tile to open its controls.
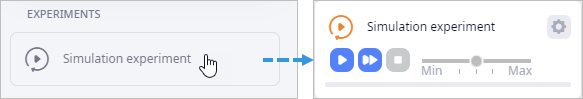
You will be taken to the Simulation experiment view with the current experiment's settings. You will see that the dashboard below the experiment parameters already contains the predefined statistics.
-
Click the toolbar
 Run in virtual time mode without animation
button to run the experiment at max speed without displaying the GIS map.
The experiment will be completed within a few seconds.
Run in virtual time mode without animation
button to run the experiment at max speed without displaying the GIS map.
The experiment will be completed within a few seconds.
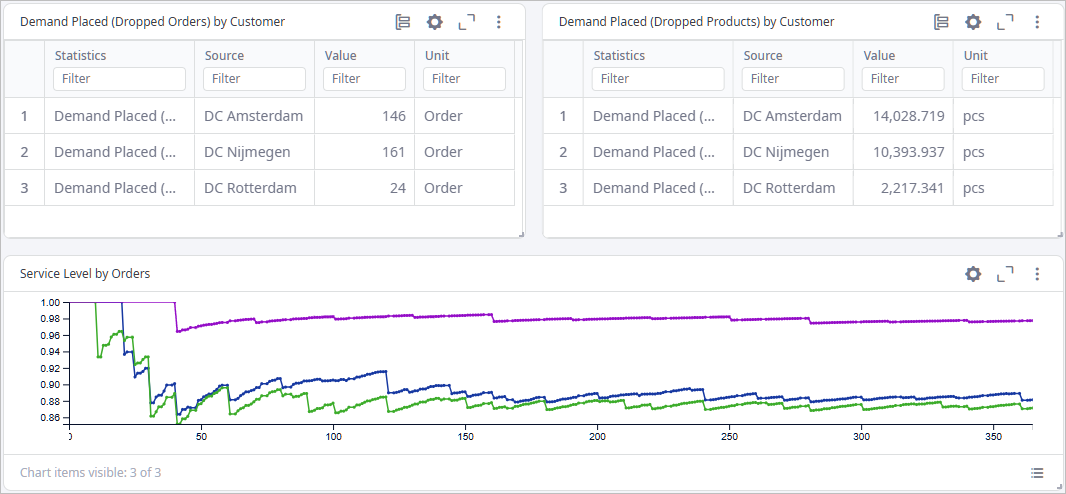
- The saved results will be available in the new Statistics tile when the experiment is completed.
- Examine the gathered statistics. You will see that the service level is not ideal because we've lost significant number of orders within the simulation period.
To avoid loss of orders and thus improve the service level we need to adjust the inventory policy parameters. One of the options is to provide each distribution center with a safety stock that will help them maintain the required level of products. This can be done in any of the following ways:
- Manually, by changing the policy type to Min-max policy with safety stock and running numerous what-if scenarios in the Simulation experiment.
- Automatically by running the Safety stock experiment.
We will stick to the latter option.
First, let us examine the current parameters of the policies.
Observe current parameters of the inventory policies
- Switch to the scenario input data by clicking the supply chain mode tile.
- Proceed to the list of tables in the lower left part of anyLogistix workspace and click the
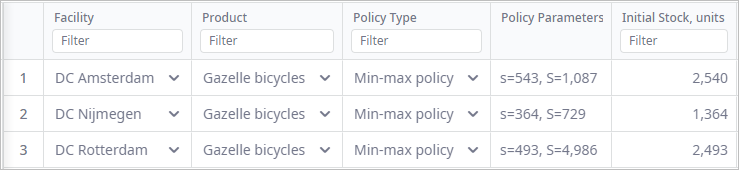
Inventory table. You will see three the Min-max policy inventory policies, one for each distribution center.
These policies must be updated to improve the service level.
We have completed the first phase of this tutorial. We have examined the statistics and observed the inventory policies that must be adjusted.
Click the link below to proceed to Phase 2 of this tutorial, in which we will run the Safety stock experiment, observe its results and convert them to a new scenario.
-
How can we improve this article?
-