

In this example, we will learn how to find the optimal locations for the new distribution centers, and how to extend the existing supply chain using Brownfield Analysis.
A German beer distributor is planning to improve its supply chain by reducing the lead time. They consider opening new distribution centers to limit service distance to the range of 200km.
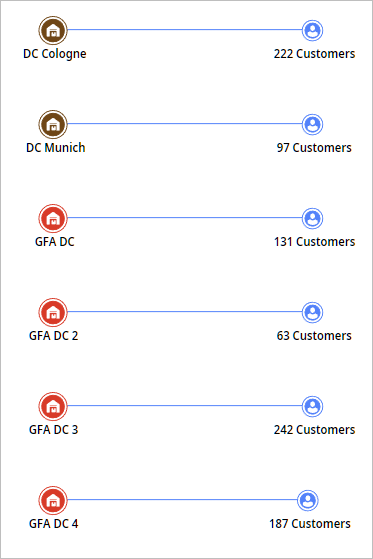
The existing supply chain comprises:
- 2 distribution centers in Cologne and Munich
- 942 customers located in the largest cities of Germany
The average beer consumption constitutes 73 bottles per capita per year. The distributor's market share is 10%.
Find the optimal number (and locations) of the new distribution centers.
With the predefined distribution centers and by selecting customers group in the settings of the experiment, Greenfield becomes Brownfield Analysis.
Let us run the GFA experiment and analyze the results.
The result of the experiment offers four new warehouses located throughout Germany. The new network structure was updated to maintain service distance constraint.
The data on product flows, distance coverage by demand and demand coverage by distance is given in the corresponding tables:
- Product Flows — shows detailed statistics on the flows of the supply chain within the specified period of time.
- Distance Coverage by Demand — shows detailed statistics on the distance to cover to satisfy a certain percentage of the demand.
- Demand Coverage by Distance (and total demand) — shows detailed statistics on the demand to satisfy within a certain distance per site created by the GFA experiment.
-
How can we improve this article?
-