

In this example we will learn how to perform the Risk Analysis experiment in anyLogistix to analyze the resilience of the supply chain. We will also define special events to implement predicted disruptions in a simulation scenario.
We consider a supply chain comprising:
- Shoes supplier in Qui Nhon
- Port in Vung Tau in Vietnam, through which the products are shipped
- Port in Kobe
- 2 sites located in Itami and Tokyo
- 50 customers in the largest cities of Japan
The demand is proportional to the population of the cities.
Supply chain operations are tightly connected with risks and uncertainties, which must be considered for proper strategic supply chain design and planning. This makes the planning process more complicated, and sets high standards for the agility and robustness of the supply chain. The risks must be identified to properly design a delivery network, define policies, and plan actions in case of an emergency.
To identify risks we specified several events, which cause a defined impact on the supply chain when triggered. We consider 6 events defined in the Events table.
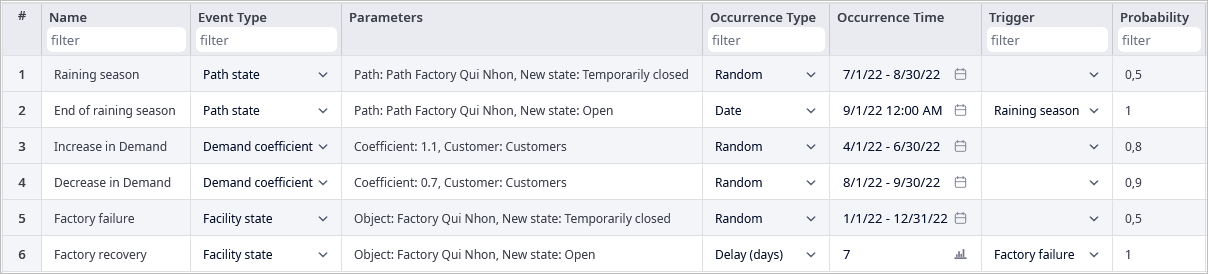
The End of raining season and Factory recovery depend on Raining season and Factory failure respectively, which means that they can be triggered only if the first pair is triggered in the simulation process.
Let us observe defined events in detail.
The Raining season event can occur with a probability of 50% in a random moment (from the defined in the Occurrence Time period) and cause unavailability of the path from Factory Qui Nhon to Port Vung Tau (defined in the Paths table). If this event is triggered, then the path becomes available again right at the start of September (End of raining season event).
The Increase in demand event will cause the demand coefficient of all customers to be equal to 1.1 (increase of demand for each customer to 10%). This event can be triggered with a probability of 80% in a random moment of the period from 04.01.2022 to 06.30.2022.
The Decrease in demand event has an opposite effect. It sets demand coefficient to 0,7 with a probability of 90% at a random moment from 08.01.2022 to 09.30.2022. Even if these events are quite similar, they are independent of one another, because no trigger dependencies are set.
The Factory failure event simulates Factory Qui Nhon breakdown with a probability of 50% any time of the year. That means that the factory will not be able to send products anymore. But we predicted that it would take only one week for the factory to recover, so the factory will start producing and sending products again after 7 days of delay after the Factory failure event has been triggered.
What will happen if the rainy season starts in Vietnam, production suspends or demand changes?
If you want to stress-test the supply chain in emergency situations you can assess particular “what-if” scenarios with the Risk Analysis experiment.
In the settings of the Risk Analysis experiment we can specify the type of the service level it will be based on, the values of failure and recovery service levels. Risk Analysis is a multi-iteration experiment. We can specify the Replications per iteration value (number of times it will be performed). Each replication will produce a different result due to stochastically changing scenario parameters
Let us run the Risk Analysis experiment and analyze results. Note that the results of the experiment will differ from the ones shown here since randomized seeds are used for every replication of the experiment.
The result contains estimated risks allowing you to design a network that will minimize possible losses and increase supply chain resilience.
If the rainy season starts in Vietnam, production suspends, or demand increases, then the service level will drop.
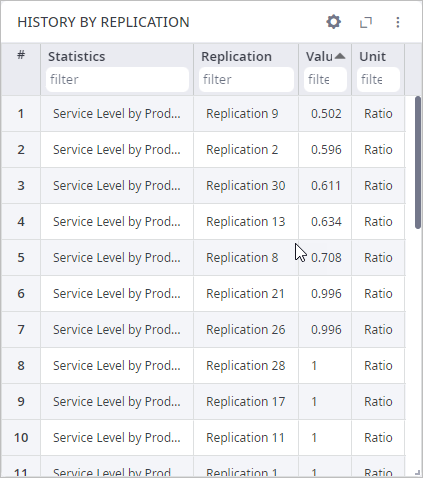
In the History by Replication statistics, we can observe the replications with low service levels. We will further analyze the data on replication with the worst service level.
To find the worst one we need to change settings to visualize data in the form of a table. Click the gear button, change the visualization method to Table, and enable Accumulative by clicking the toggle button.
Now we will analyze data in the Events and Recovery tab.
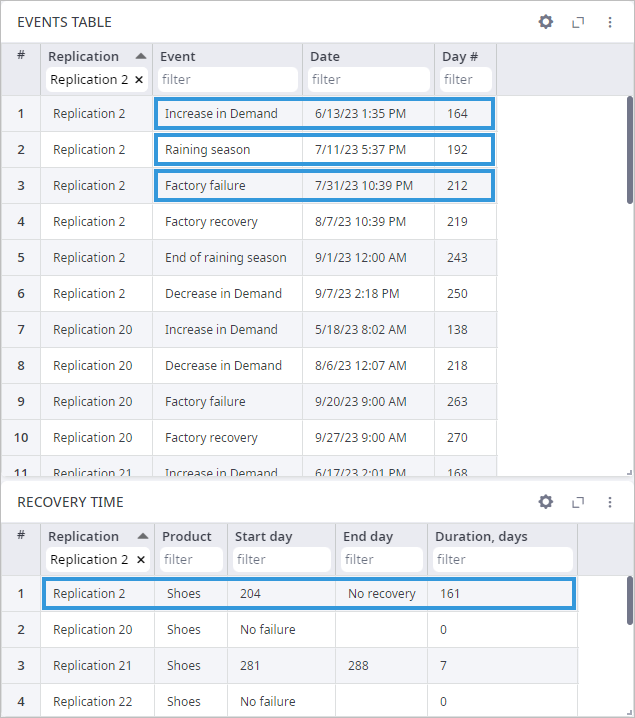
- In the Events Table statistics, we can see that two events took place:
- Increase in demand (on the 116th simulation day)
- Raining season (on the 188th simulation day)
The raining season later ended, and the demand decreased.
- In the Recovery Time statistics, we can see that the service level dropped below the Failure service level (defined in the parameters of the experiment) on the 197th day of the simulation, and never recovered.
By thoroughly analyzing the data on total cost, revenue, profit, etc., which is available in the corresponding tabs below the currently open Events and Recovery page we can receive more accurate information revealing the actual reasons for the decrease in service level.
This information can be used to improve the scenario input and avoid risks.
-
How can we improve this article?
-