

This example illustrates a supply chain with a widespread network of customers. Network Optimization allows selecting the required supply chain configuration. The example also shows the way to define import tariffs for the customers from a number of countries where it is required.
For a better understanding of this scenario and its structure you can watch a demo video of this example.
To proceed with this scenario, you should take a look at the SIM Global Network Examination example, which analyzes data collected from simulation experiment and draws conclusions about supply chain performance.
We consider a supply chain with factories producing home and garden products in Xiamen and Shenzhen (China), which are provided with the required components by the supplier located in Shantou (China).
Five products are produced within the supply chain: lighting, large home appliances, furniture, gardening equipment, small appliances.
The products are purchased by customers in Africa, Asia, Australia, Europe, North America, South America, and the European and Asian parts of Russia:
- China: Huai’an, Nanchang and Guilin
- India: Hyderabad, Chandrapur and Malegaon
- Europe: Milan, London, Brussels and Munich
- North America: New York, Phoenix, Denver, Indianapolis and Dallas
- South America: Sao Paulo, Buenos Aires, Asuncion and Manaus
- Russia: Moscow and Yekaterinburg
Product shipping to a customer can be done directly from the factory, ports, distribution centers, or from ports through distribution centers.
Port locations: Port Houston, Port Guayaquil, Port Durban, Port Sydney.
- Asia: products can be delivered to customers from factories directly or from a distribution center (Huai’an, Nanchang, Guilin (China), Hyderabad, Chandrapur, Malegaon (India)). We can use only one distribution center in China and one in India.
- Australia: products can be delivered only from Port Sydney.
- Europe: products can be delivered only from one of the following distribution centers: Milan, London, Brussels or Munich.
- North America: products can be delivered to customers directly from Port Houston or through a distribution center (New York, Phoenix, Denver, Indianapolis or Dallas).
- South America: products can be delivered to customers directly from Port Guayaquil or through a distribution center (Sao Paulo, Buenos Aires, Asuncion, or Manaus).
- European and Asian parts of Russia: products can be delivered only from one of the following distribution centers: Moscow or Yekaterinburg.
| Country/Product | Lighting | Large home appliances |
Furniture | Gardening equipment |
Small appliances |
|---|---|---|---|---|---|
| Europe | 3.70% | 1.90% | 6.50% | 6.00% | 1.90% |
| USA | 2.60% | 0.00% | 5.90% | 5.30% | 0.00% |
| Australia | 5.00% | 5.00% | 5.00% | 5.00% | 5.00% |
| Canada | 7.00% | 4.00% | 6.50% | 6.50% | 4.00% |
| India | 20.00% | 8.00% | 10.00% | 10.00% | 8.00% |
| Russia | 9.50% | 9.50% | 0.00% | 6.50% | 9.50% |
| South Korea | 8.00% | 8.00% | 6.50% | 7.00% | 8.00% |
| South Africa | 10.00% | 25.00% | 20.00% | 20.00% | 25.00% |
| Brazil | 18.00% | 20.00% | 16.00% | 18.00% | 20.00% |
| Peru | 4.00% | 11.00% | 6.00% | 6.00% | 11.00% |
| Argentina | 21.40% | 20.00% | 18.00% | 18.00% | 20.00% |
| Bolivia | 12.00% | 4.00% | 48.00% | 10.00% | 15.00% |
| Colombia | 5.00% | 15.00% | 15.00% | 8.00% | 15.00% |
| Paraguay | 9.60% | 20.00% | 18.00% | 18.00% | 20.00% |
| Chile | 6.00% | 6.00% | 6.00% | 6.00% | 6.00% |
| Ukraine | 2.80% | 3.30% | 0.00% | 6.50% | 3.30% |
| Vietnam | 13.80% | 14.00% | 20.00% | 20.00% | 14.00% |
Determine the best shipping method for each customer considering the constraints.
You may notice that icons of certain distribution centers are of different color. We wanted to make them noticeable on the map because those are not ordinary distribution centers. distribution centers with blue icons represent Ports. This means that products should be taken to the destination distribution centers through the ports, and then to the customers.
The paths connecting factories and ports are made straight to prevent ground delivery.
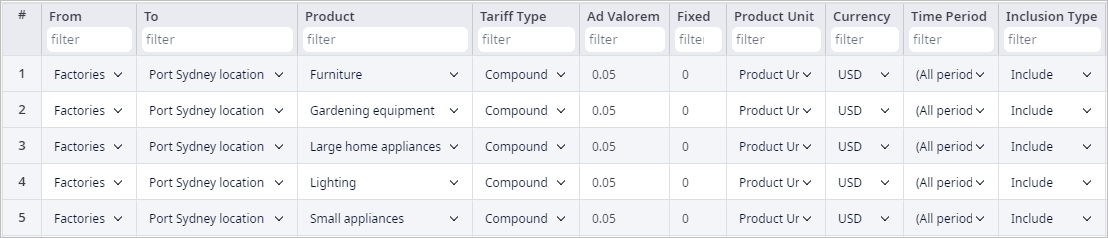
We should also consider tariffs, since customers are located in different countries and even continents. The table above contains tariffs for every product we want to deliver in every country. In anyLogistix, there are two types of tariffs: Tariffs and Customer Tariffs. If products are delivered to the customers from the facility located in the same country, the tariffs are paid by the company. If not, Customers Tariffs are considered.
Note that Customer Tariffs are paid by the customers, so they are not included into the Total Cost statistics. So, we won’t add its value to the Objective.
We need to specify tariffs for every customer, except the Chinese customers, because the product is made in China. To decrease the number of rows and simplify the understanding of the logic the table contains, we are using predefined groups.
Also the previously defined Constraints show that there are special requirements for a number of sites in different regions. All these constraints are configured in the Assets Constraints table.
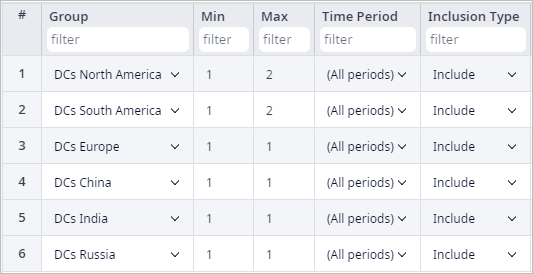
As we can see, the minimum number of distribution centers in the supply chain is 6, while the maximum number is 8. These constraints will be considered by the CPLEX, and all suggested results will follow the defined rules.
The result of the experiment offers to open the following distribution centers:
- DC Nanchang in China
- DC Chandrapur in India
- DC Dallas in North America
- DC Sao Paulo, DC Buenos Aires in South America.
- DC Brussels in Europe
- DC Moscow in the European part of Russia
The Iterations panel shows the result of the experiment with all the possible combinations sorted per the Profit KPI metric.
The top iteration card is the best one.
The data on other details is shown in the corresponding tables:
-
How can we improve this article?
-