

In this example, we will observe a scenario with comparison of the two inventory policies: Min-Max policy with safety stock and Material Requirement Planning policy.
We consider a supply chain in the USA comprising:
- Toothbrush Factory
- 2 sites supplying customers
The demand is distributed stochastically and is proportional to the population of the cities. Some customers order toothbrushes every day, others once in two weeks.
The demanded quantity of toothbrushes is evenly divided between the two sites, which have different inventory replenishment policies:
- One site orders products when the inventory level falls below a fixed replenishment point
- The other one orders products based on calculated inventory forecast for the horizon period
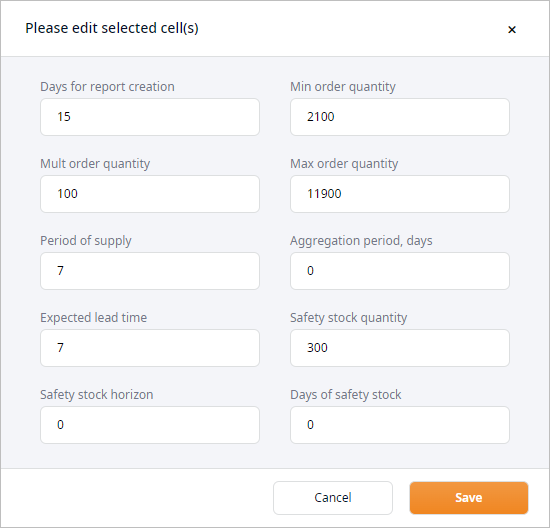
The Min-Max with safety stock policy requires only 3 parameters (Min, Max, and Safety stock) to be defined run properly, while the MRP policy requires more parameters and more complicated ones. For better understanding the parameters of the MRP policy and the way it performs, you can see the special tutorial.
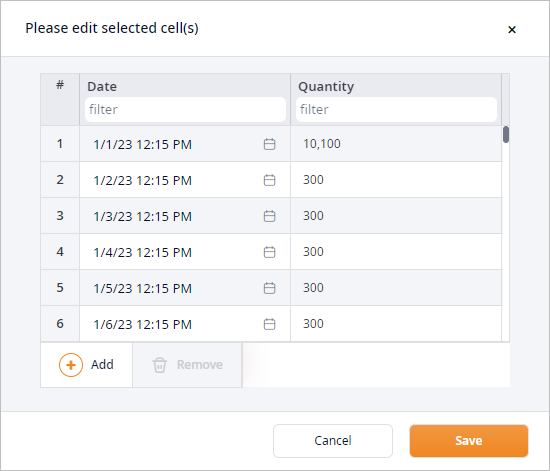
The Demand Forecast table is essential for MRP policy. This data is used by the MRP policy to calculate inventory forecasts. It contains aggregated demand of customers attached to the selected facility.
For example, 10100 toothbrushes are expected to be ordered on 01.01.2022 from the DC Lancaster, because it is the first day of the order interval for customers, which are ordering once in two weeks. Starting from 01.02.2022 only 300 toothbrushes are expected to be ordered per day, since it is only “everyday” customers who order these days. The next big order is expected to be on 01.16.2022 (10100 pcs), when “two weeks” customers will be ordering again.
The goal is to compare different inventory policies and choose the one that helps to maintain a sufficient inventory level when we do not know the amount of product that can be demanded.
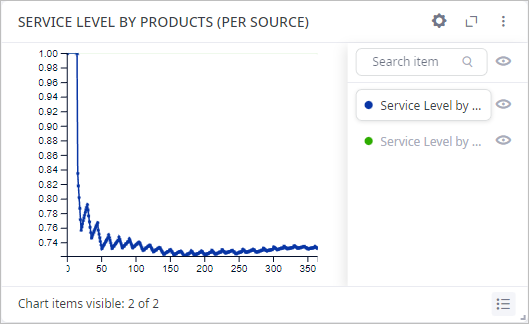
If we compare the service levels of the two distribution centers in the received results, we will see that service level at DC Harrisburg is worse than the service level at DC Lancaster.
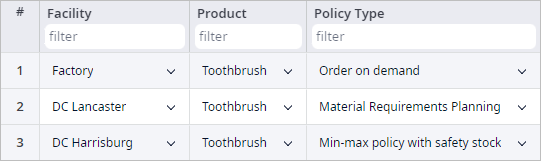
To find the reason we will navigate to the Inventory table. As you can see on the screenshot below the DC Harrisburg uses the Min-max policy with safety stock, while DC Lancaster is using the Material Requirements Planning policy, which allows it to maintain the required service level.
The result of the experiment shows that we obtain the better service level when we estimate expected customer demand for certain products over the specified period, than when we set a fixed replenishment point for inventory level.
-
How can we improve this article?
-