

In the previous phase we created a new scenario and found the optimal location for our distribution center. In this phase we will:
- Convert result to a new scenario and analyze the input data
- Extend the supply chain by adding customers and their demand in Austria and Italy
Let us start with converting the received result to a new GFA scenario.
Convert result to a new scenario
- Right-click the Result item and select the
Convert to a new scenario option in the pop-up menu.
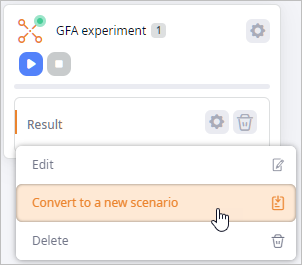
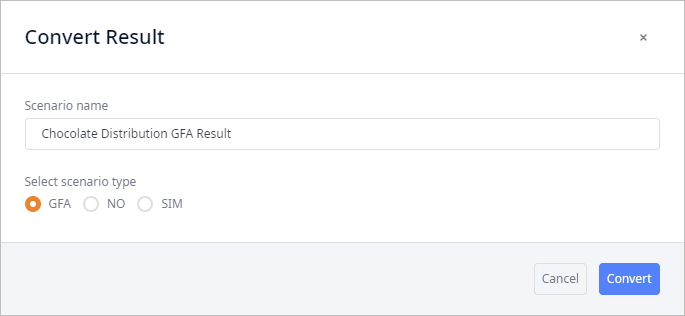
- The Convert Result dialog box will open.
We will keep the offered name. Select the GFA scenario type label.
Click Convert to convert the result and close the dialog box.
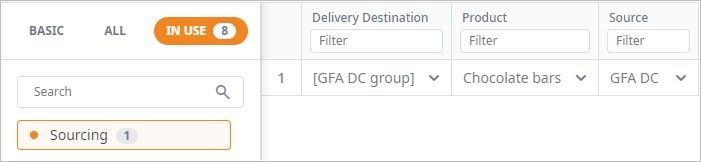
Let us examine the tables of the Chocolate Distribution GFA Result scenario that have been updated with the new data:
-
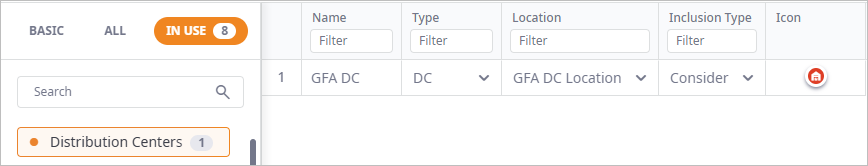
Distribution Centers — now contains data on the new distribution center
(GFA DC), for which the experiment found the optimized location.
-
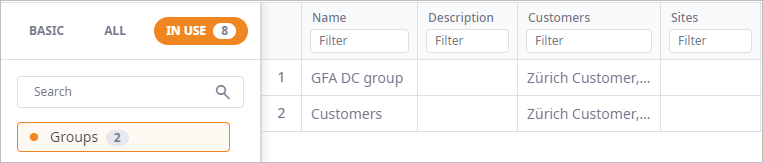
Groups — now contains the group of customers (GFA DC group) supplied by the new distribution center.
- Locations — now contains the location of the new distribution center.
-
Sourcing — now contains the sourcing policy describing that the existing customers
are supplied by the new GFA DC distribution center.
So we have a functioning supply chain. Now we will add 20 customers to 10 major cities of Austria and Italy.
To save some time we will import the predefined data from this template that you need to fetch.
Add customers and their demand
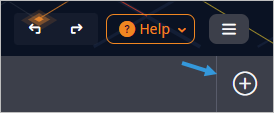
- Click the Add button on the left side of the scenarios ribbon.
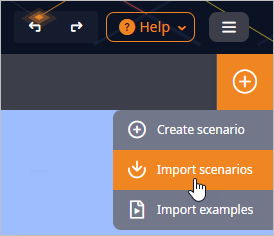
- Now select
 Import scenarios in the opened menu.
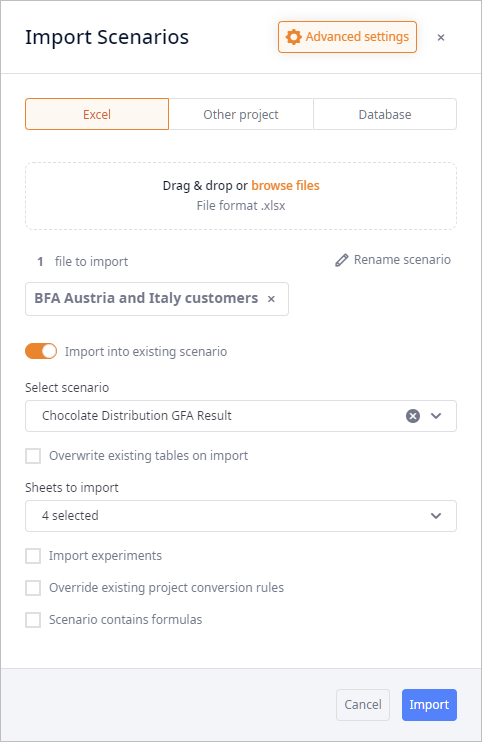
The Import Scenarios dialog box will open.
- Select the MS Excel file with the scenario data by clicking the Drag & Drop or browse files tile in the dialog box, and navigating to the saved file.
- Click the Advanced options button in the header of the dialog box to open the advanced section.
- Enable Import into existing scenario, then select the Chocolate Distribution GFA Result scenario from the Select scenario drop-down list. In this way, we will import the data of the selected MS Excel file into the existing scenario.
- Click the Sheets to import drop-down list and check the following table to import:
- Customers — contains the required 20 customers.
- Demand — contains the demand data for the new customers.
- Groups — contains two groups with the new customers (one group per country).
- Locations — contains locations for the new customers.
We are importing tables with the predefined data, so we do not need to remove the existing data in the destination scenario to avoid data duplication
- Now deselect the following options: Import experiments, and Override existing project conversion rules.
- Click Import to import the data.
When done, you will see all the customers on the map.
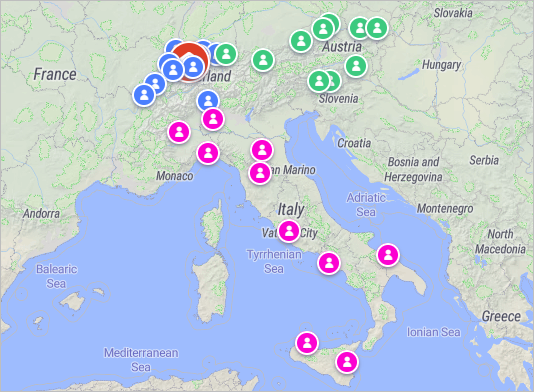
With the last step we have completed Phase 2 of this tutorial.
We have extended our supply chain with additional customers in Austria and Italy. We have also added demand for the new customers.
In the third phase we will set up and run the GFA experiment, examine and convert the results to a new scenario.
-
How can we improve this article?
-