

The collected data can be visualized by either a Table or a Chart.
To select the statistics visualization method
-
Click the
 cogwheel icon in the top-right corner of the desired element.
The chart's settings will open.
cogwheel icon in the top-right corner of the desired element.
The chart's settings will open.
-
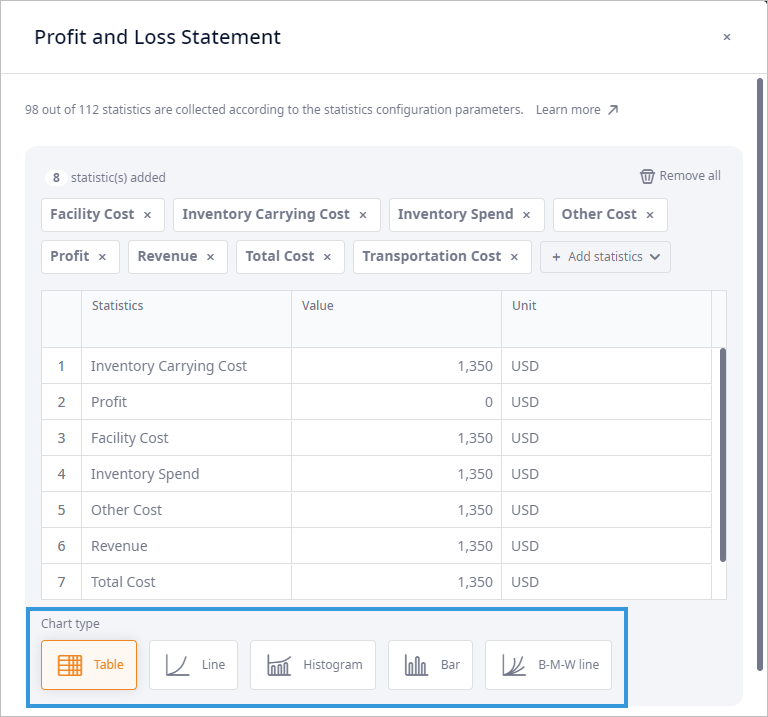
In the Chart type section below the preview area select the desired visualization method:
- Table — presents the statistics data in tabular form (in rows and columns).
- Line — presents the statistics data as a series of data points plotted along the time axis.
- Histogram — presents the probability distribution of the statistics data.
- Bar — presents the statistics data as single values as of the experiment current model date.
- B-M-W line — filters the required statistics data to present only the best, mean and worst values. It presents the statistics data as a series of data points plotted along the time axis.
-
How can we improve this article?
-