

You may need to model non-deterministic processes, e.g. product demand changing, product processing time, or speed of a certain vehicle. Stochastic processes can be defined using probability distributions.
anyLogistix comes with a set of probability distributions.
- Uniform distribution
- Triangular distribution
- Exponential distribution
- Normal distribution
- Lognormal distribution
- Gamma distribution
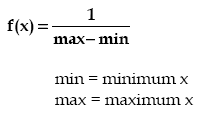
The Uniform distribution is a continuous distribution bounded on both sides, i.e., the sample lays in the interval [min,max). The probability density does not depend on the value of x. It is a special case of the Beta distribution. It is frequently called rectangular distribution (see Johnson et al).
The Uniform distribution is used to represent a random variable with constant likelihood of being in any small interval between min and max. Note that the probability of max value is 0; the max point never occurs.
- Parameters
-
Name Type Description min double the minimum x value max double the maximum x value
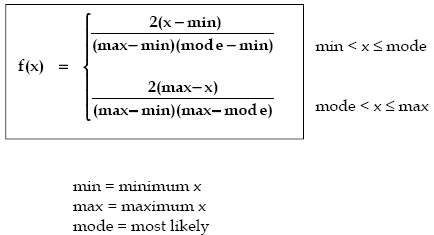
The Triangular distribution is a continuous distribution bounded on both sides.
The Triangular distribution is often used when no or little data is available; it is rarely an accurate representation of a data set. However, it is employed as the functional form of regions for fuzzy logic due to its ease of use.
The Triangular distribution can take on very skewed forms including negative skewness. For the exceptional cases where the mode is either the min or max, the Triangular distribution becomes a right triangle.
- Parameters
-
Name Type Description min double the minimum x value max double the maximum x value mode double the most likely x value
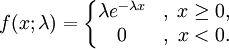
The Exponential distribution is a continuous distribution bounded on the lower side. It’s shape is always the same, starting at a finite value at the minimum and continuously decreasing at larger x. The Exponential distribution decreases rapidly for increasing x.
The Exponential distribution is frequently used to represent times of a specific operation.
- Parameters
-
Name Type Description lambda double the shape parameter min double the minimum x value
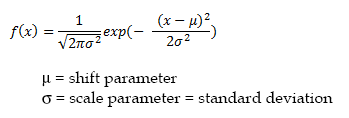
The Normal distribution is an unbounded continuous distribution. It is sometimes called a Gaussian distribution or the bell curve. Because of its property of representing an increasing sum of small, independent errors, the Normal distribution finds many uses in statistics. It is wrongly used in many situations. Possibly, the most important test in the fitting of analytical distributions is the elimination of the Normal distribution as a possible candidate.
The Normal distribution is frequently used to represent symmetrical data, but suffers from being unbounded in both directions. If the data is known to have a lower bound, it may be better represented by suitable parameterization of the Lognormal distribution.
- Parameters
-
Name Type Description sigma double the shape parameter = standard deviation mean double the shift parameter = mean value
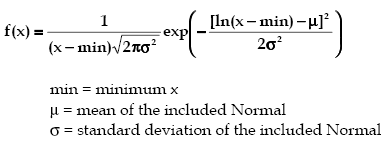
The Lognormal distribution is a continuous distribution bounded on the lower side. It is always 0 at minimum x, rising to a peak that depends on both mu and sigma, then decreasing monotonically for increasing x.
By definition, the natural logarithm of a Lognormal random variable is a Normal random variable. Its parameters are usually given in terms of this included Normal.
The Lognormal distribution can also be used to approximate the Normal distribution, for small sigma, while maintaining its strictly positive values of x [actually (x-min)].
The Lognormal distribution is used in many different areas including the distribution of particle size in naturally occurring aggregates, dust concentration in industrial atmospheres, the distribution of minerals present in low, concentrations, duration of sickness absence, physicians' consultant time, lifetime distributions in reliability, distribution of income, employee retention, and many applications modeling weight, height, etc.(see Johnson et. al.1)
- Parameters
-
Name Type Description mu double the mean of the included Normal sigma double the standard deviation of the included Normal min double the minimum x value
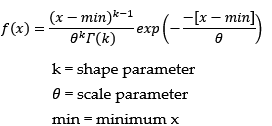
The Gamma distribution is a continuous distribution bounded at the lower side. It has three distinct regions.
- For k=1, Theta=1/lambda the Gamma distribution reduces to the exponential (lambda) distribution, starting at a finite value at minimum x and decreasing monotonically thereafter.
- For k<1, the Gamma distribution tends to infinity at minimum x and decreases monotonically for increasing x.
- For k>1, the Gamma distribution is 0 at minimum x, peaks at a value that depends on both k and Theta, decreasing monotonically thereafter.
If k is restricted to positive integers, the Gamma distribution is reduced to the Erlang distribution.
The Gamma distribution can also be used to approximate the Normal distribution, for large alpha, while maintaining its strictly positive values of x [actually (x-min)].
The Gamma distribution has been used to represent lifetimes, lead times, personal income data, a population about a stable equilibrium, interarrival times, and service times. In particular, it can represent lifetime with redundancy.
- Parameters
-
Name Type Description k double the shape parameter > 0 Theta double the scale parameter > 0 min double the minimum x value
-
How can we improve this article?
-