

In the previous phase we imported the scenario and examined the statistics with the data gathered by the Simulation experiment. In this phase we will set up and run the variation experiment to define the optimal parameters of the Inventory policy.
Create Variation experiment and configure statistics to collect
- In the experiments section click the Variation experiment tile to open its controls and settings.

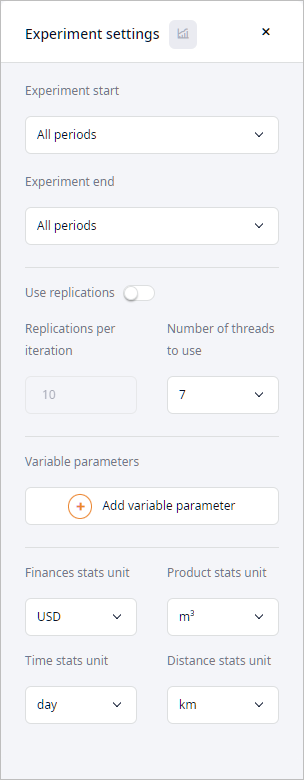
- In the settings area leave the experiment's default start and end dates.
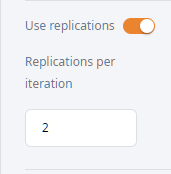
- Enable the Use replications setting, then specify 2 in the
Replications per iteration field.
We need replications since demand of the Boston customer is set to a probability distribution. The model will have stochastic behavior resulting in a less representative experiment run. To improve representability we will enable replications, which will result in conducting several runs per each iteration. Keep in mind that replications require more time to complete the experiment.
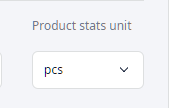
- Click the Product stats unit drop-down list and select pcs,
since it is the product stats unit defined in the Products table.
- Enable the Lost orders statistics:
- Click the
 Statistics configuration
icon to open the Statistics configuration dashboard.
Statistics configuration
icon to open the Statistics configuration dashboard.
- Type Dropped Orders in the search box to filter statistics.
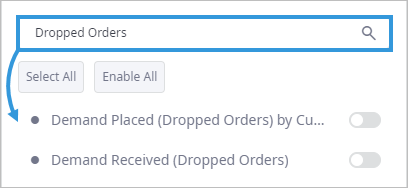
- Enable the toggle button of the Demand Placed (Dropped Orders) by Customer to activate data collection for these statistics.
- Click the
- In the same way check the Total cost statistics. It should be enabled by default.
- Once you are done with configuring statistics, click the
 Statistics configuration icon to close the dashboard.
Now we will define the variable parameters, i.e., the data the experiment will work with. In our case we will vary the Min and Max parameters of the inventory policy.
A variable parameter that you define is set for a single parameter only. If you need to vary several parameters during the experiment, you need to create a separate variation for each parameter.
Define variable parameters
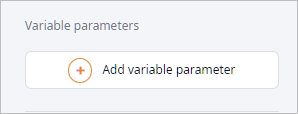
- In the experiment settings click Add variable parameter.
A dialog box will open with the scenario's parameters that you can vary.
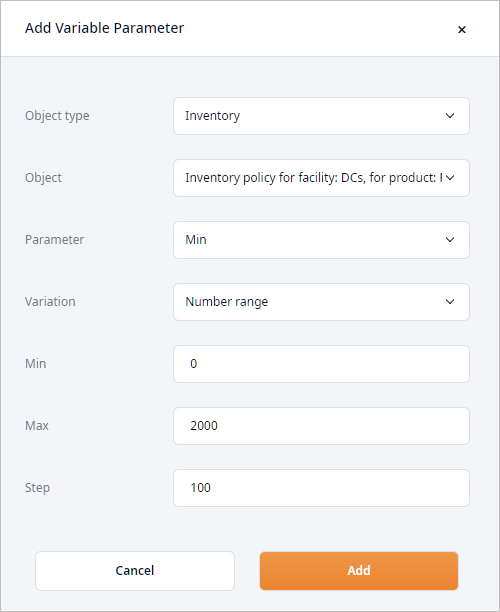
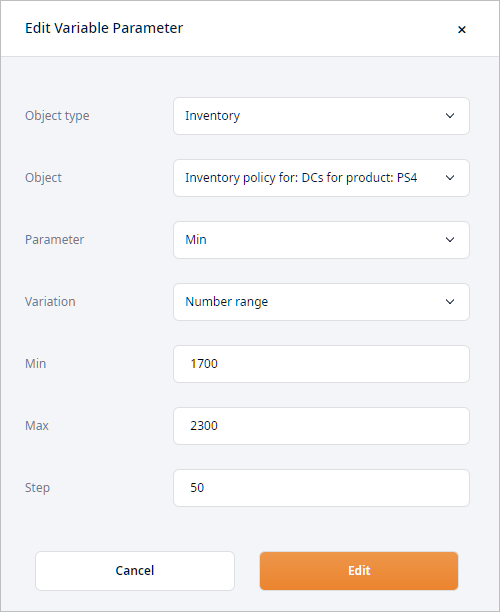
- Define variation of the min parameter as shown on the screenshot below.
Click Add to close the dialog box.
-
In the same way create variation of the Max parameter and set its
Min and Max values to 2000 and
3000 respectively.
There, we have defined two variable parameters of the inventory policy.
We have completed setting up the Variation experiment and may run it now.
Run the Variation experiment
-
Click
 Run on the experiment's tile.
A table will appear updating its records with results received in real-time. Experiment execution will take some time.
Run on the experiment's tile.
A table will appear updating its records with results received in real-time. Experiment execution will take some time.
- Observe the final results. When the experiment is completed, you will be taken to the Variation results tab of the new Result item of the Variation experiment.
-
Click the Mean column referring to the Demand Placed (Dropped Orders) by Customer statistics
to sort the records in the ascending order and see the best available result.
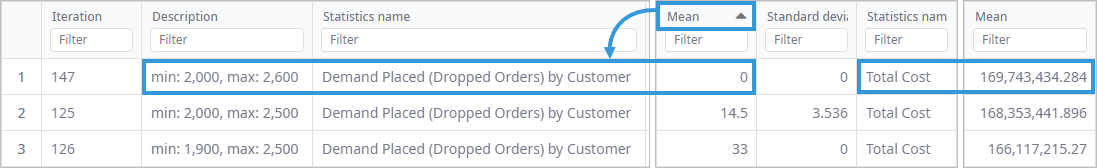
As you can see there is one successful result with no dropped orders. the best one is the top one. According to it, if the Min and Max values of the inventory policy parameters are set to 2,000 and 2,600 respectively, we will not lose a single order, and we will incur the total expenses of $169,743,434.284, which is more than the initial amount, but it is the price we have to pay to maintain high quality of delivery service.
You can navigate to the Inventory table and update the parameters of the defined policy with the acquired data.
The received results can be improved by adjusting the variable parameters for the experiment.
Based on the range of values that we specified for the two variables, the experiment suggests the Min and Max values to be set to 2,000 and 2,600 respectively. Now that we know these Min and Max values, we may adjust the variable parameters by altering the range of the variables and the step of variation to receive a more precise result.
Adjust the variable parameters
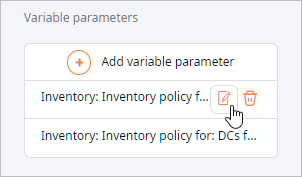
- Hover your mouse over the first variable and click Edit to open the dialog box.
- Change the Min and Max values to 1,700 and 2,300 respectively.
- Set Step to 50.
- Click Edit to close the dialog box.
- In the same way adjust the second variable by changing its Min and Max values to 2,300 and 2,900 respectively, and setting Step to 50.
- Run the Variation experiment and examine the final results, which will be located in Result 2 item of the
Variation experiment.
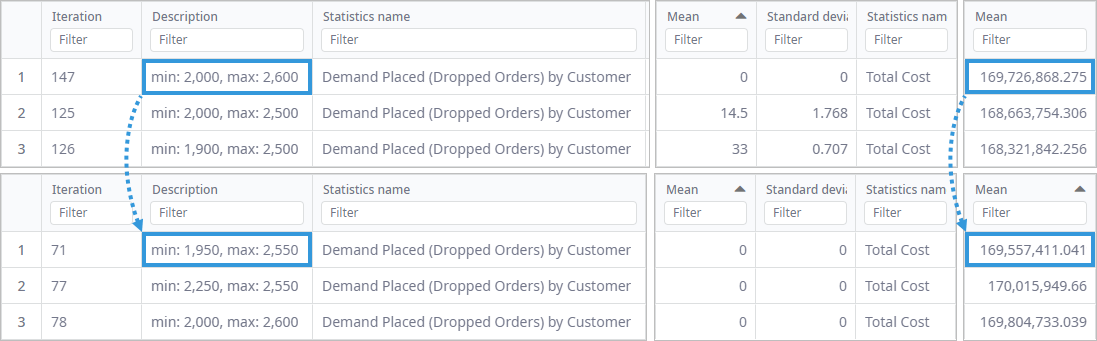
As you can see there are numerous successful results with no dropped orders. We will additionally perform sequential sorting to see the best result in terms of costs. Press and hold the Alt key (or Option for macOS), then click the Mean column name referring to the Total cost statistics.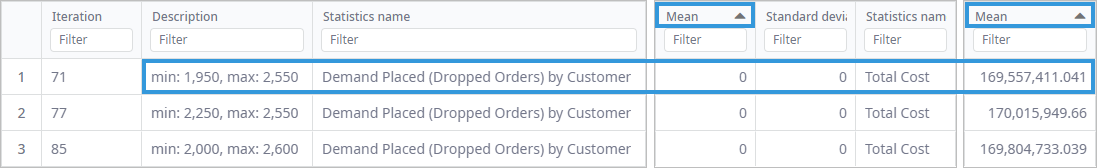
-
Compare the received results with the results from the Result item of the Variation experiment branch.
You will see that the incurred expenses are less this time, and we have still managed to satisfy our customer's demand.
The received result can be adjusted again to provide even more precise inventory policy parameters. You can:
- Decrease the specified range of each variable parameter (e.g. Min — 1800-2200, Max — 2200-2800).
- Decrease the step size from 50 to 25, 10 or 5 (the smaller the step is, the more time it requires to complete the experiment).
- Increase the quantity of replications to 5-10 (the more replications per iteration, the more time it requires to complete the experiment).
You can navigate to the Inventory table and update the parameters of the defined policy type with the acquired data.
We have successfully completed the Variation experiment tutorial.
-
How can we improve this article?
-