

In this example, we will learn how to implement cash flows accounting in the supply chain by creating individual cash account for different branches of the network (in this case, country). Also, we will learn how to define the special payment terms for distribution centers and customers. And in the end, we will compare the results of a simulation experiment between these accounts, using cash to serve statistics.
A smartphone manufacturer wants to determine the cost-effectiveness of each distribution center. This can be done by analyzing operating cash flow, i.e., we need to obtain detailed information on cash flows within the supply chain (including cash on hand, loans, interests, account payable and account receivable) for the period of one year.
We consider a supply chain in Asia comprising:
- Smartphone supplier located in South Korea
- Customers in China, South Korea, and Japan
- Distribution centers in:
- Changleng and Tianjin (China)
- Seoul and Miryang (South Korea)
- Hachioji (Japan)
Transportation is done by:
- Truck from the factory to South Korea
- Plane from the factory to China and Japan
- Medium truck from distribution centers to customers
The expected order delivery lead time depends on the destination country:
- China — 2 days
- Japan — 1.5 days
- South Korea — 1 day
Demand is of stochastic nature. The order interval on average is 7 days.
The network that company operates is divided into 3 subsidiaries (distributors) within one company for each country. The financial structure of the company assumes an individual cash account for each distributor.
Every distributor's cash account has its own initial cash and payment terms in every country:
- China account:
- Initial cash = $ 1 138 680
- Days payable outstanding (DPO) = 15 days
- Days sales outstanding (DSO) = 45 days
- When distributor purchases smartphones from the supplier the down payment ratio is 10%
- When customers order smartphones from the distributor the down payment ratio is 30%
- Japan account:
- Initial cash = $ 175 440
- Days payable outstanding = 15 days
- Days sales outstanding = 35 days
- When distributor purchases smartphones from the supplier the down payment ratio is 10%
- When customers order smartphones from the distributor the down payment ratio is 30%
- South Korea account:
- Initial cash = $ 183 360
- Days payable outstanding = 10 days
- Days sales outstanding = 35 days
- When distributor purchasing smartphones from the supplier the down payment ratio is 20%
- When customers order smartphones from the distributor the down payment ratio is 30%
Initial cash is numerically equal to the initial inventory value, but it is taken as a negative number because the company spent it on products for the initial stock. Payment deadlines for suppliers are shorter than payment deadlines from customers.
Analyze operating cash flow, obtain detailed information on cash flows within the supply chain (including cash on hand, loans, interests, account payable and account receivable) for the period of one year.
Compare the cost-effectiveness of distribution centers in different countries.
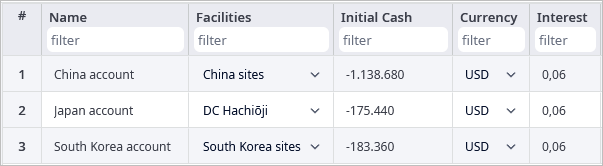
In the Cash Accounts table, we defined individual accounts for China, Japan, and South Korea that contain data on Initial cash and Interest. The interest rate for every account is set to 0.06. We assume it is the average interest rate for business loans.
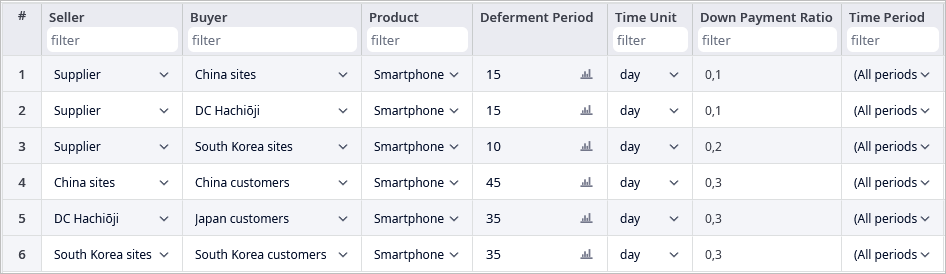
All the data about the down payment and deferment periods for the objects of the supply chain is defined in the Payment Terms table. Note, that the Down Payment Ratio should be defined in the interval (0;1).
In the simulation scenarios we can specify the expected time the whole process of delivering products to the customer takes. This Expected Lead Time can be defined in the Demand table for every customer-product combination. Considering values from the Problem Definition section, we set the expected lead time for every demand record. These values will be used to calculate ELT Service Level statistics.
The example allows us to simulate financial flows in the supply chain for distributors with different financial inputs.
According to the collected statistics we earn more than we spend:
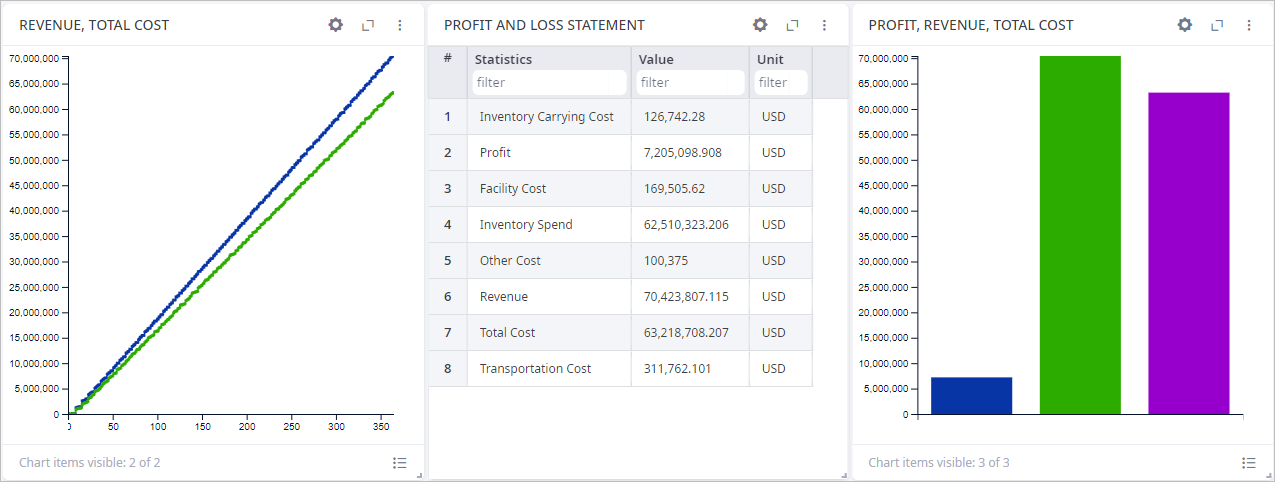
However, the Cash page shows that not everything is so great.
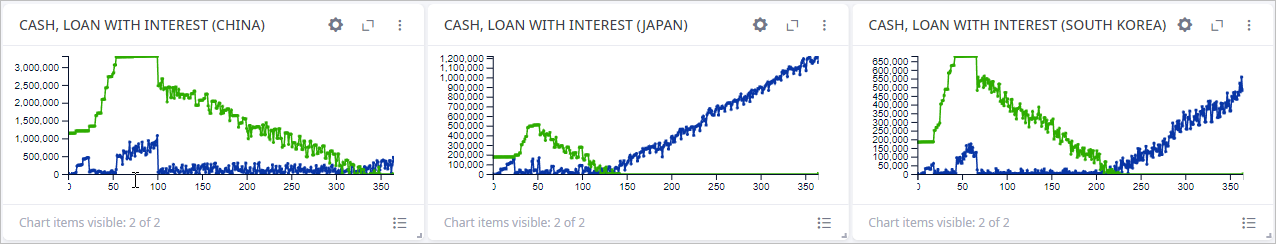
We reach the break-even point in:
- China — only by the end of the year.
- Japan — in the middle of the second quarter of the year.
- Korea — in the middle of the third quarter of the year.
You can also analyze results on:
- The debt dynamics on the Payment Terms tab.
- The cost of the loan service on the Loan and Interest tab.
- The ELT level on the Service Level tab, which shows that the ELT is down for most of the customers.
-
How can we improve this article?
-