

The results of the GFA with roads experiment offer a more accurate location of the distribution centers, since the experiment considers actual roads. Your objects will not be placed on top of a mountain or in a middle of a swamp.
Based on the data provided in the scenario tables, the GFA with roads results offer:
- Locations for the distribution centers/warehouses considering actual roads.
- Sourcing policies — where customers buy the products.
The saved results can be:
The results are available in the dashboard below the experiment's view in the form of statistics, distributed through the pages on the left (each page refers to a certain type of statistics). If required, you can rename, remove a page, or export the content of the page's statistics to an MS Excel file:
- Product Flows — shows detailed statistics on the flows of the supply chain within the specified period of time.
- New Site Locations — shows information on all the new sites created by the experiment.
- Distance Coverage by Demand — shows detailed statistics on the distance to cover to satisfy a certain percentage of the demand.
- Demand Coverage by Distance — shows detailed statistics on the demand to satisfy within a certain distance.
To see experiment results
- Run the experiment.
- Once the experiment is completed, a new Result item will be created below the
GFA with roads experiment tile.
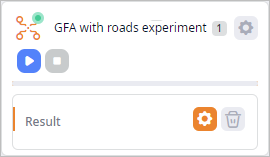
- Click Result, to analyze the results.
GFA result data cannot be edited unless you convert it to a scenario.
-
How can we improve this article?
-