

In this phase we will import the scenario, add factory, define its location, and update the inventory and sourcing policies.
Let us start with obtaining the data that will serve as the basis for our experiment. You may either provide your own data or you can instantly import the scenario. Either way, you should have a supply chain scenario comprising:
- Customers
- Product(s)
- Demand
- Distribution center(s) located in the optimal places
- Inventory
- Properly configured sourcing and paths
The numbered lists in tutorials are actually checklists. Click the numbers to save your progress!
Download and import the scenario
- Download the scenario. No internet connection is required, since the scenario is supplied with anyLogistix.
- Import the downloaded scenario. The GIS map will appear showing the content of the imported scenario.
- Explore the connections by clicking the
 Show connections button.
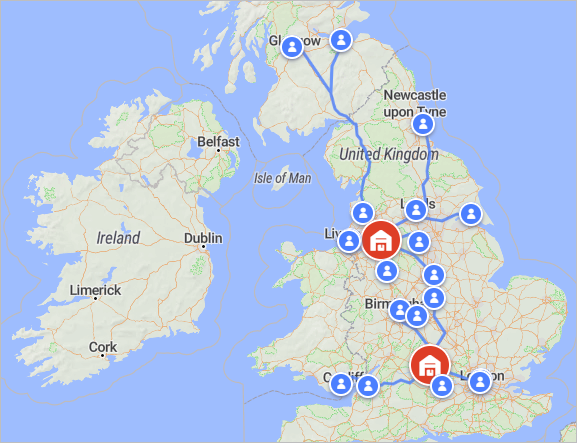
In this scenario 20 UK customers are supplied with food storage containers and cake moulds by two distribution centers located in Oxford and Manchester.
Run the Simulation experiment and observe results
- In the experiments section click the Simulation experiment tile to open its controls.
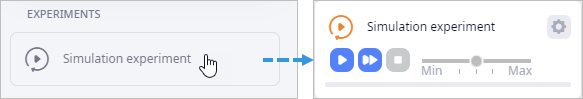
You will be taken to the Simulation experiment view with the current experiment's settings. You will see that the experiment is already configured (the statistics are defined and located in the dashboard).
- Click the
 Run in virtual time mode without animation
button to run the experiment at max speed without displaying the map. The experiment will be completed within a few seconds.
Run in virtual time mode without animation
button to run the experiment at max speed without displaying the map. The experiment will be completed within a few seconds.
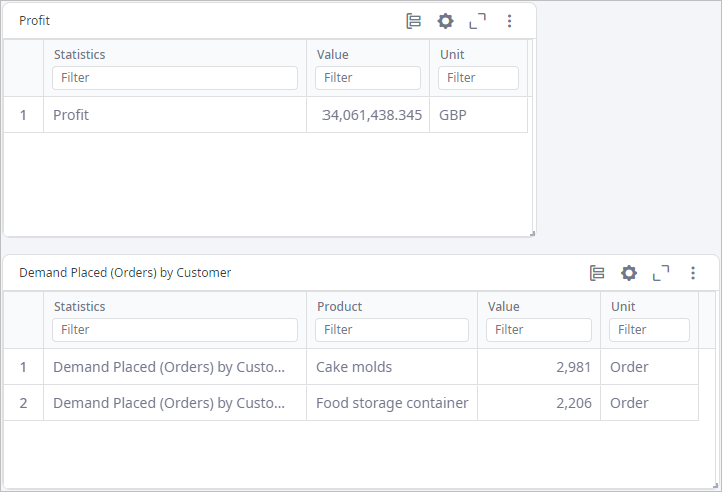
- Examine the gathered statistics, which will be available in the Statistics tile when the experiment is completed:
- Profit — the amount the supply chain gained as a profit.
- Demand Placed (Orders) by Customer — the number of placed orders per product.
We have observed the current status of the supply chain. Now we will extend this supply chain. Let us start with adding a factory object.
Add factory to the supply chain
-
Switch to the scenario input data by clicking the supply chain mode tile.
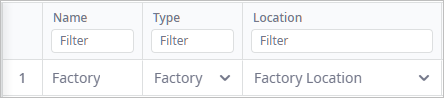
- Open the Factories table and click Add.
-
We will keep the default Factory name of the object.
We have added a new factory, now we will define a specific location for it.
Define location of the factory
- Open the In Use tab to see only the tables containing scenario data.

- Open the Locations table and scroll down to the Factory location record.
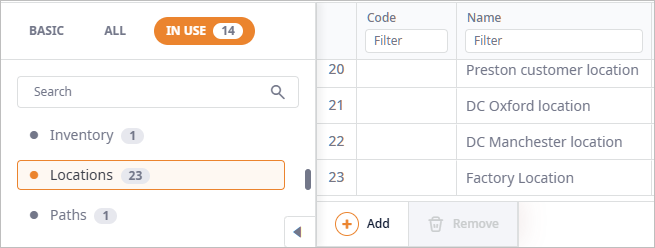
- Define the city in which this factory is located by typing Hereford in the City cell.
- Now type United Kingdom in the Country cell to define the
country, in which this city is located.
Alternatively you can copy the country name from any other cell of this column and then paste. - Finally, click the Autofill Coordinates button in the last column cell. The factory will be moved to Hereford.
We have just added a new object, which is the source of the products now. To properly define the product flow we must adjust the sourcing and the inventory policies.
We will start with the inventory policy. We will assume that the distribution centers are using the Min-max policy to replenish the available stock from the factory, while the factory has Unlimited inventory.
Adjust inventory policy
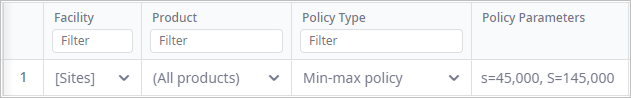
- Navigate to the Inventory table.
- Double-click the (All sites) cell in the Facility column and select the
[Sites] group from the drop-down list of available facilities.
This group contains the two distribution centers only, since it was created before we added the factory object.
You can check the content of this group by navigating to the Groups table and double-clicking the Sites cell of the Sites group.
- Change the Policy Type for objects in this group to Min-max policy, which allows products to be ordered when the inventory level falls below a fixed replenishment point.
- Double-click the Policy Parameters cell and set the Min and Max parameters to 45 000 and 145 000 respectively.
- Click Save to save the changes and close the dialog box. The record should look like this:
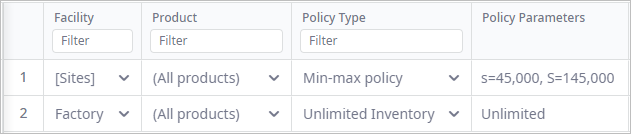
- Now create a new record by clicking Add and define
Unlimited inventory for the Factory facility:
Now we will define the sourcing policy that will consider the factory object. According to this policy the customers will be supplied by the distribution centers, while the distribution centers will be supplied by the factory.
Create a sourcing policy
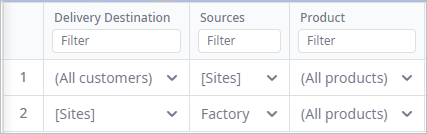
- Navigate to the Sourcing table. First, we will adjust the default policy.
- Double-click the cell of the Sources column and
- Uncheck the All sites checkbox
- Check the [Sites] checkbox
This will allow all customers to be supplies by the two distribution centers.
- Create a new record by clicking Add in the table's toolbar.
- Set Delivery Destination to Sites.
- Double-click the Sources column cell and
- Uncheck the All sites checkbox
- Check the Factory checkbox
There, we have introduced the factory and defined the inventory and the sourcing policies. We may run the experiment now.
Run the experiment
- Click the Simulation experiment tile to open its controls.
- Click
 Run.
Run.
While the experiment is executing, we may add statistics that will help us analyze the product flows. We will add two statistics:
- Demand Placed (Orders) by Site — to observe data on the amount of replenishment orders each distribution centers placed.
- Available inventory — to observe the current inventory level per distribution center.
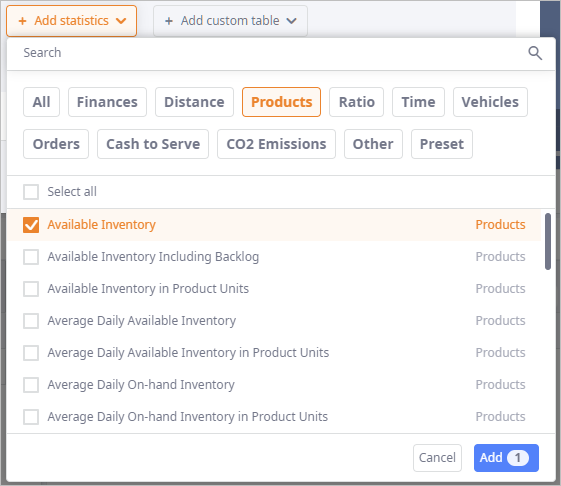
Add statistics to the dashboard
- Click the Add New chart button in the Dashboard toolbar. The chart settings dialog box will open.
- Click the Add statistics drop-down list.
- In the drop-down list click the Orders tag to filter the list by the statistics of this category.
-
Select the checkbox next to the Demand Placed (Orders) by Site statistics.
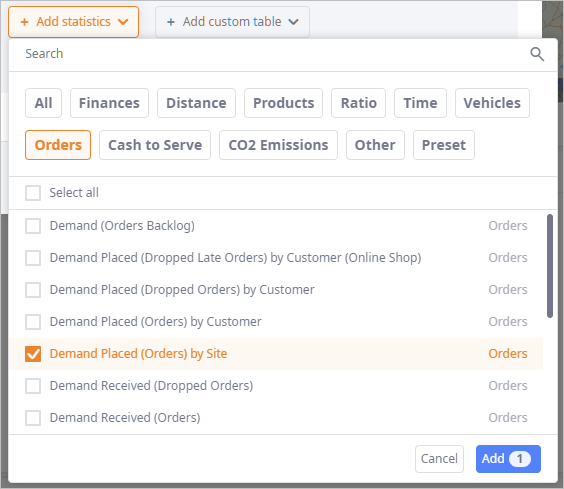
- Click Add to add this statistic to the chart.
-
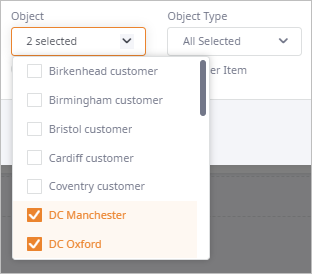
In the details and filters section open the Object drop-down list and check the two distribution centers.
Now the data will be shown on these distribution centers only.
- Finally, click the Per Item toggle button.
Now the data will be shown per distribution center.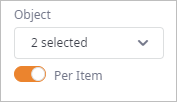
- Click Apply to close the dialog box and add the statistics to the dashboard.
You will see that the added statistics instantly shows the current number of placed orders.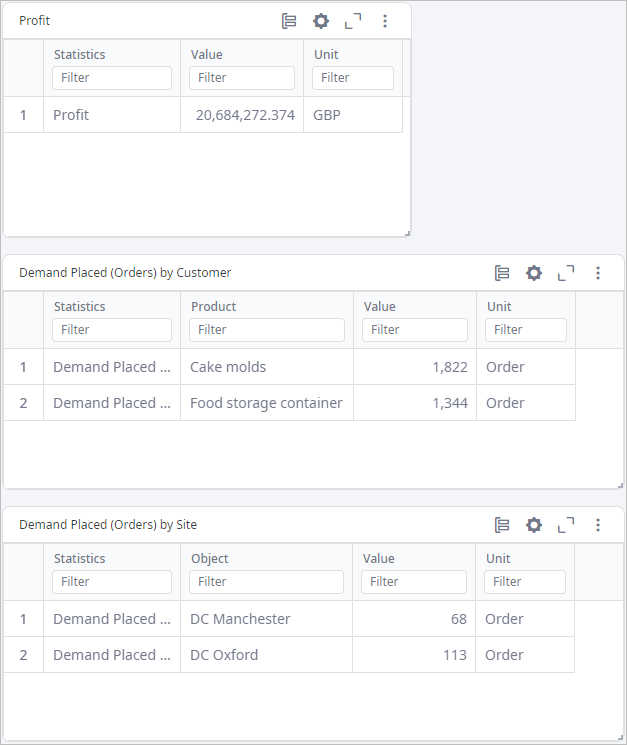
- In the same way add the Available Inventory statistics from the Products category.
- Set up the new statistics:
- In the details and filters section open the Object drop-down list and check the two distribution centers.
- Now in the chart settings area select Line as the Chart type, then click the
Daily radio button to observe data per each day of simulation.
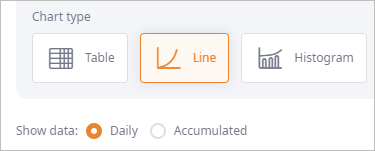
- Click the Per Item toggle button.
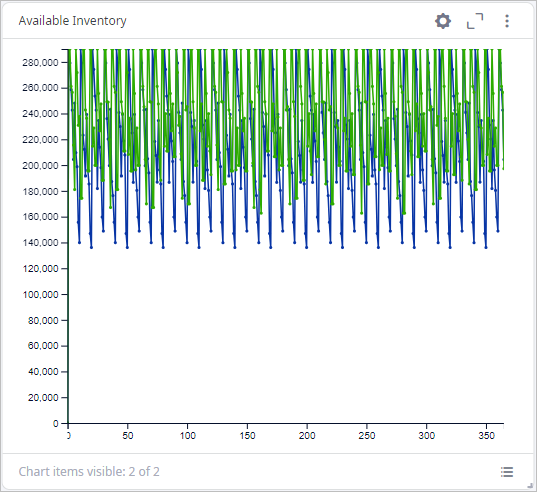
- Click Apply to close the dialog box and add the statistics to the dashboard.
- The chart will instantly show the current available inventory of each distribution center. Observe the data.
With the final step we complete the first phase of this tutorial. We imported the supply chain scenario, added factory and defined the sourcing and inventory policies.
In the next step we will define production with raw materials.
Click the link below to proceed to Phase 2 of this tutorial.
-
How can we improve this article?
-