

In this phase we will obtain the input data and add events to the scenario. You may use your own input data as the basis for our experiment, or you may fetch and import our scenario.
Either way, you should have a supply chain model containing the following parameters:
- Customers with demand
- Distribution centers with limited inventory policies
- Supplier, replenishing inventory of the distribution centers
The numbered lists in tutorials are actually checklists. Click the numbers to save your progress!
Download and import the scenario
- Fetch the scenario. No internet connection is required, since the scenario is supplied with anyLogistix.
- Import the downloaded scenario. The GIS map will appear showing the content of the imported scenario.
- Explore the connections by clicking the
 Show connections button.
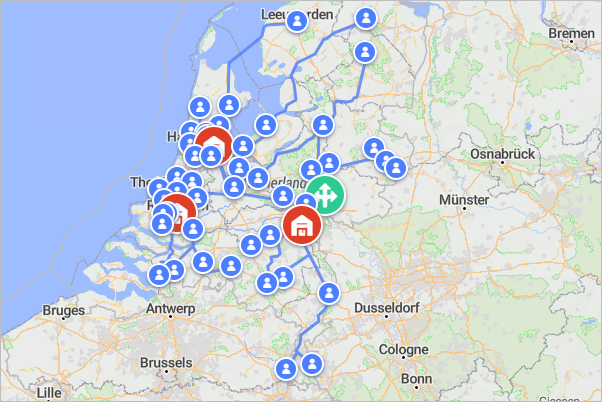
The imported scenario contains a supply chain with 50 customers in the largest cities of the Netherlands, 3
distribution centers, and the Royal Gazelle bicycle factory, as the supplier.
Let us run the Simulation experiment and observe the gathered statistics.
Run the Simulation experiment and examine the result
- In the experiments section click the Simulation experiment tile to open its controls.
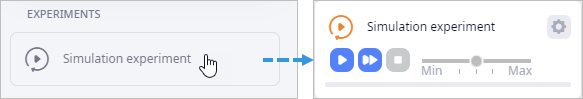
You will be taken to the Simulation experiment view with the current experiment's settings.
You will see that the experiment is already configured (the statistics are defined and located in the dashboard). - Click the toolbar
 Run in virtual time mode without animation button to run the experiment at max speed without displaying the map.
The experiment will be completed within a few seconds.
Run in virtual time mode without animation button to run the experiment at max speed without displaying the map.
The experiment will be completed within a few seconds.
- Examine the gathered statistics. You will see that the service level is perfect.
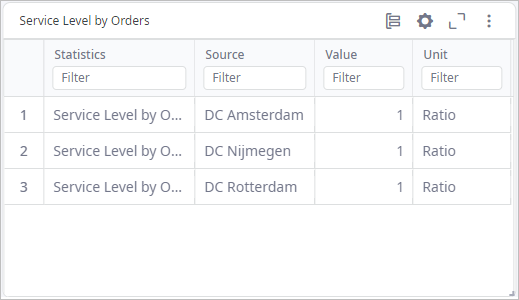
The supply chain is properly optimized and works like it should. Let us add a few events that will simulate risks affecting the supply chain. We will simulate factory failure and increase/decrease of demand.
Add event that will close the factory
- Switch to the scenario input data by clicking the supply chain mode tile.
- Navigate to the Events table of the new Gazelle Factory Risk Analysis scenario and click Add to create a new record.
- Click the cell in the Name column and type Failure. This record will imitate factory failure. It can fail for any reason, we are not currently interested in the specific reason.
- Leave the selected by default Facility state in the Event Type column as it is, since we want this event to change the facility state.
- Double-click the cell in the Parameters column to open the dialog box.
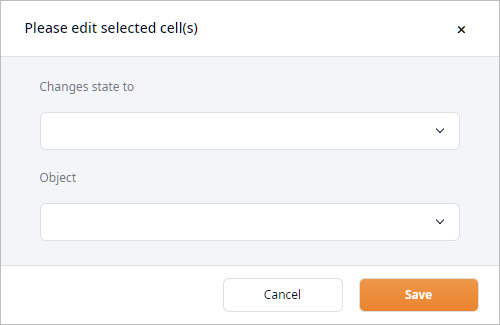
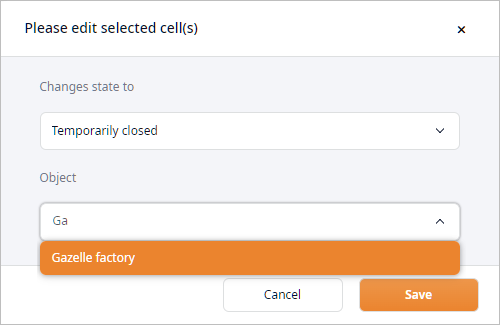
- Open the Changes state to drop-down list and select Temporarily closed. This will make the event close the facility.
- Now open the Object drop-down list and select Gazelle factory.
You can filter the available objects by typing the first letters of the facility's name in the field of the opened drop-down list.
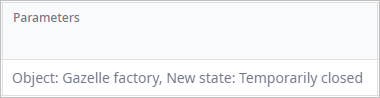
- Click OK to close the dialog box. The table cell will now contain the details on the set parameters.
- Double-click the Occurrence Type cell and select Random from the drop-down list. This will make the event occur at random moment within the Occurrence Time, which we will define in the next step.
- Double-click the Occurrence Time cell to open the dialog box, allowing you to define the event's start and end dates.
- Set the start and end dates to 3/1/23 and 3/31/23 respectively.
You can either type the dates directly in the fields, or you can click the
 button to use the
date chooser.
button to use the
date chooser.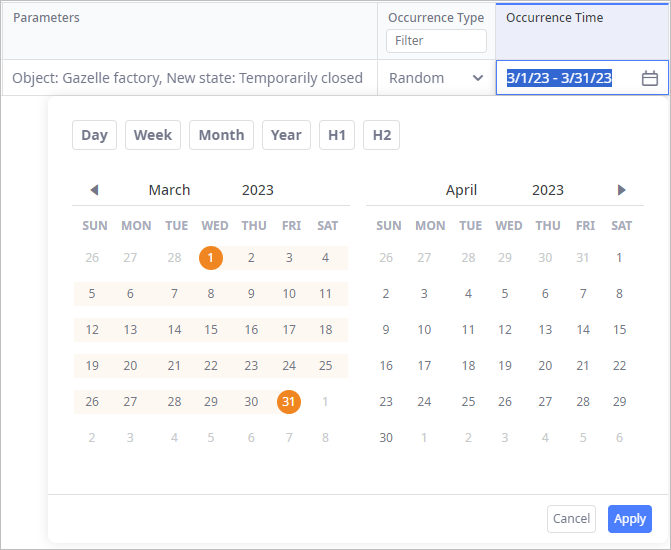
- Click anywhere outside the box to close it.
- Now we will define the probability, with which this event will occur. Click the cell in the
Probability column and type 0.3.
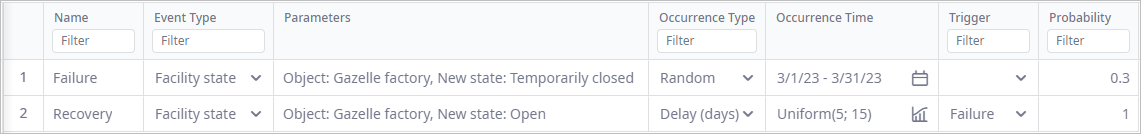
Finally, the table must look like this:
That's it, we have created the event that will close the factory. Since we haven't defined the event that will open the factory, the factory will remain closed.
Let us create the second event that will open the factory.
Create event that will open the factory
- Click Add to create a new event.
- Name it Recovery.
- Double-click the Parameters cell and set:
- Changes state to to Open
- Object to Gazelle factory
- Double-click the Occurrence Type cell and select Delay (days). In this way we will set this event to occur some time later after the Failure event takes place.
- Click the Occurrence Time cell and click the chart icon next to the cell value to open the drop-down menu.
We will define a stochastic value.
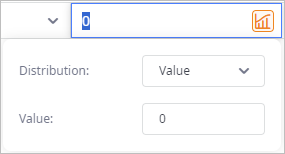
- Click the Type drop-down list and select Uniform. New parameters will appear for Min and Max values.
- Set the Min and Max values to 5 and 15 respectively. This will make the event occur with the delay of 5 to 15 days.
- Double-click the Trigger cell and select Failure from the drop-down list.
-
Leave Probability set to its default 1 value.
That's it. This event will launch factory in the period from 5 to 15 days from the date the Failure event closes this factory.
We have created two events that will affect facility state. Now we will add events affecting demand coefficient. Let us start with the event increasing demand, which will take place somewhere in May - June.
Create event increasing demand
- Click Add to create a new event and name it Increase in demand.
- Double-click the Event Type cell and select Demand coefficient from the drop-down list.
- Double-click the Parameters cell and set:
- Coefficient to 10
- Object to [Customers]
- Double-click the Occurrence Type and select Random.
- Double-click the Occurrence Time cell and set the event's start and end dates to 5/1/23 and 6/30/23 respectively.
- In the Probability cell type 0.8.
In the same way create event decreasing demand.
Create event decreasing demand
- Click Add to create a new event and name it Decrease in demand.
- Double-click the Event Type cell and select Demand coefficient from the drop-down list.
- Double-click the Parameters cell and set:
- Coefficient to 0.7
- Object to [Customers]
- Double-click the Occurrence Type and select Random.
- Double-click the Occurrence Time cell and set the event's start and end dates to 11/1/23 and 11/30/23 respectively.
- In the Probability cell type 0.9.
Finally, the table must look like this: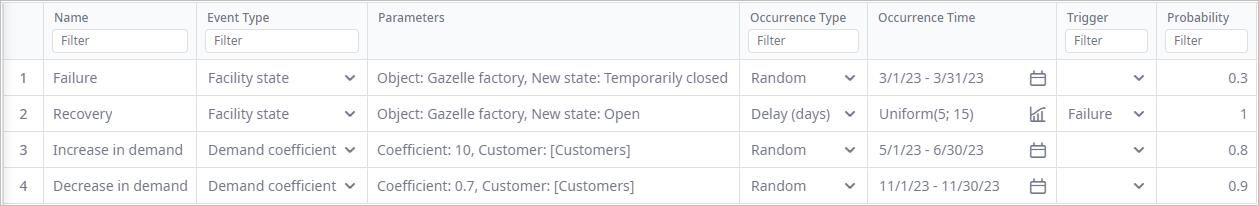
We have completed the first phase of this tutorial. We have obtained the scenario and added events to it. Click the link below to proceed to Phase 2 of this tutorial, in which we will run the Risk Analysis experiment and observe the received results.
-
How can we improve this article?
-