

In this example, we will learn how to define BOMs and production for the product that has additional by-products. These by-products cannot be produced by themselves but have their demand and selling prices. Also, we will observe production planning taking into account demand and penalties for all these products.
Note that the actual scenario data in anyLogistix PLE may differ from this description.
A company acquires cottonseed oil factories in China.
The maximum monthly throughput of each factory constitutes 20000 tons of cottonseeds.
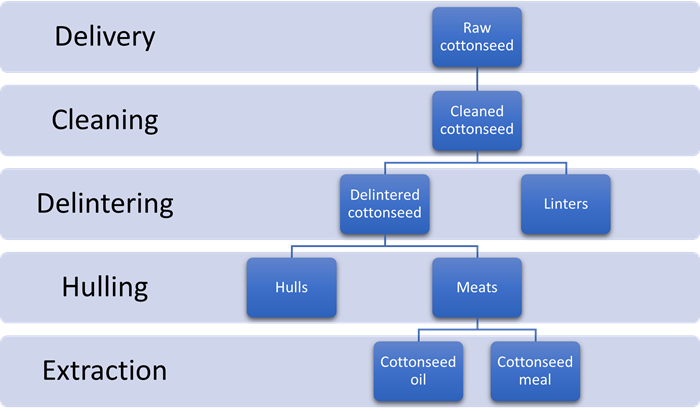
These are zero waste factories producing linters, hulls and cottonseed meals as by-products. Production structure can be represented as:
The supply chain comprises:
- 70 customers in China, India, Pakistan, and Australia
- Two factories in China
- Three suppliers in China
- Four ports: in China, India, Pakistan, and Australia
We want to choose optimal locations for:
- Two distribution centers in China
- Two distribution centers in India
- One distribution center in Pakistan
- One distribution center in Australia
Products are delivered to India, Pakistan, and Australia by sea through the port of Hong Kong.
The by-products (linters, hulls, and cottonseed meals) are also processed:
- Linters are further used in papermaking
- Cottonseed hulls are sold as animal food
- Cottonseed meals are typically utilized as a protein supplement for beef cattle
| Country/Product | Oil | Meal | Hulls | Linters |
|---|---|---|---|---|
| India | 35% | 45% | 45% | 45% |
| Pakistan | 8.14% | 10.13% | 8.14% | 10.13% |
| Australia | 5% | 5% | 9% | 5% |
Demand differs for each product:
- Cottonseed oil — the total annual demand constitutes 10 liters per capita.
- Cottonseed meal — the average demand constitutes 245 tons per week per customer.
- Hulls — the average demand constitutes 270 tons per week per customer.
- Linters — the average demand constitutes 83 tons per week per customer.
Demand for cottonseed oil and its by-products changes during the modeling period of three years:
- It is constant during the first year for all products.
- It increases for Oil by 30% in August and September during the second and the third years.
- It decreases for cottonseed meal by 30% from April to October during the third year.
Find optimal locations (from the list of available locations) for the required number of distribution centers.
Analyze the data within the three years on Demand fulfillment, Production utilization.
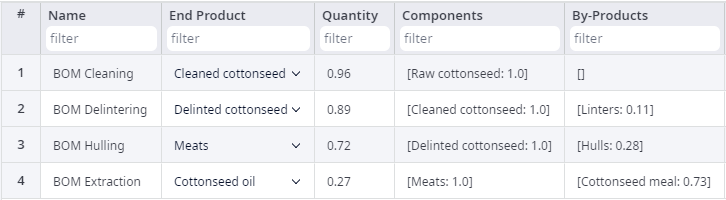
As mentioned earlier, both factories are producing not only the main product but also the by-products, which do not have their BOM, or production defined. So, they can be produced only when the main product is made. The BOM table contains information on the main products, by-products, number of the required components, and the amount of products produced. These BOMs represent the production structure of factories shown earlier.
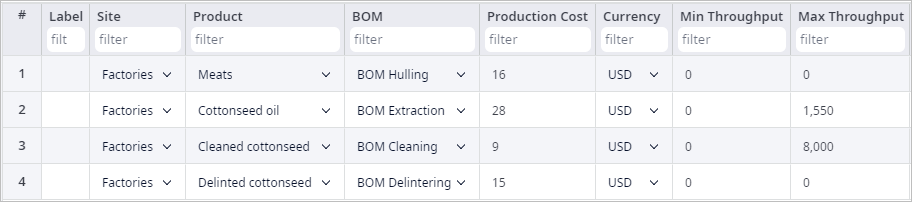
The Production table contains data on the products that are produced in the factories (production costs, BOMs' names).
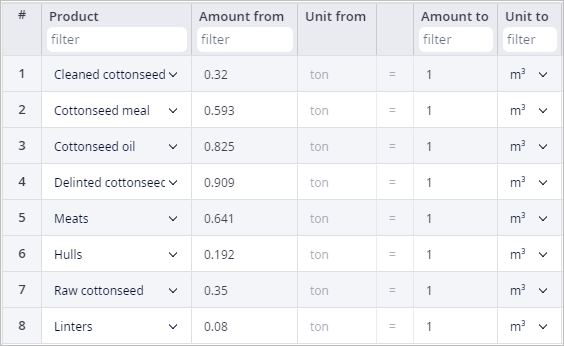
Note that the products, defined in this scenario, are measured in tons, while vehicle capacity, certain transportation policies, and facility expenses are set to m3 unit. That is why we define conversion rules for every product in the Unit Conversions table.
Results offer us several supply chain configurations with detailed statistics, which show that:
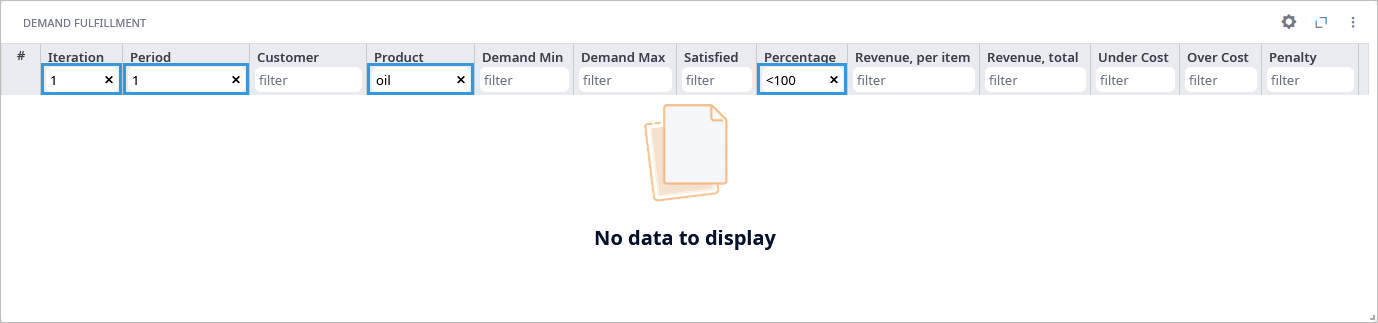
- During the first year demand for cottonseed oil was completely satisfied, while the demand for the by-products was partially satisfied.
If we had produced additional batches to fully satisfy demand for the by-products, we would have created a glut of the main product, thus making the supply chain less profitable.
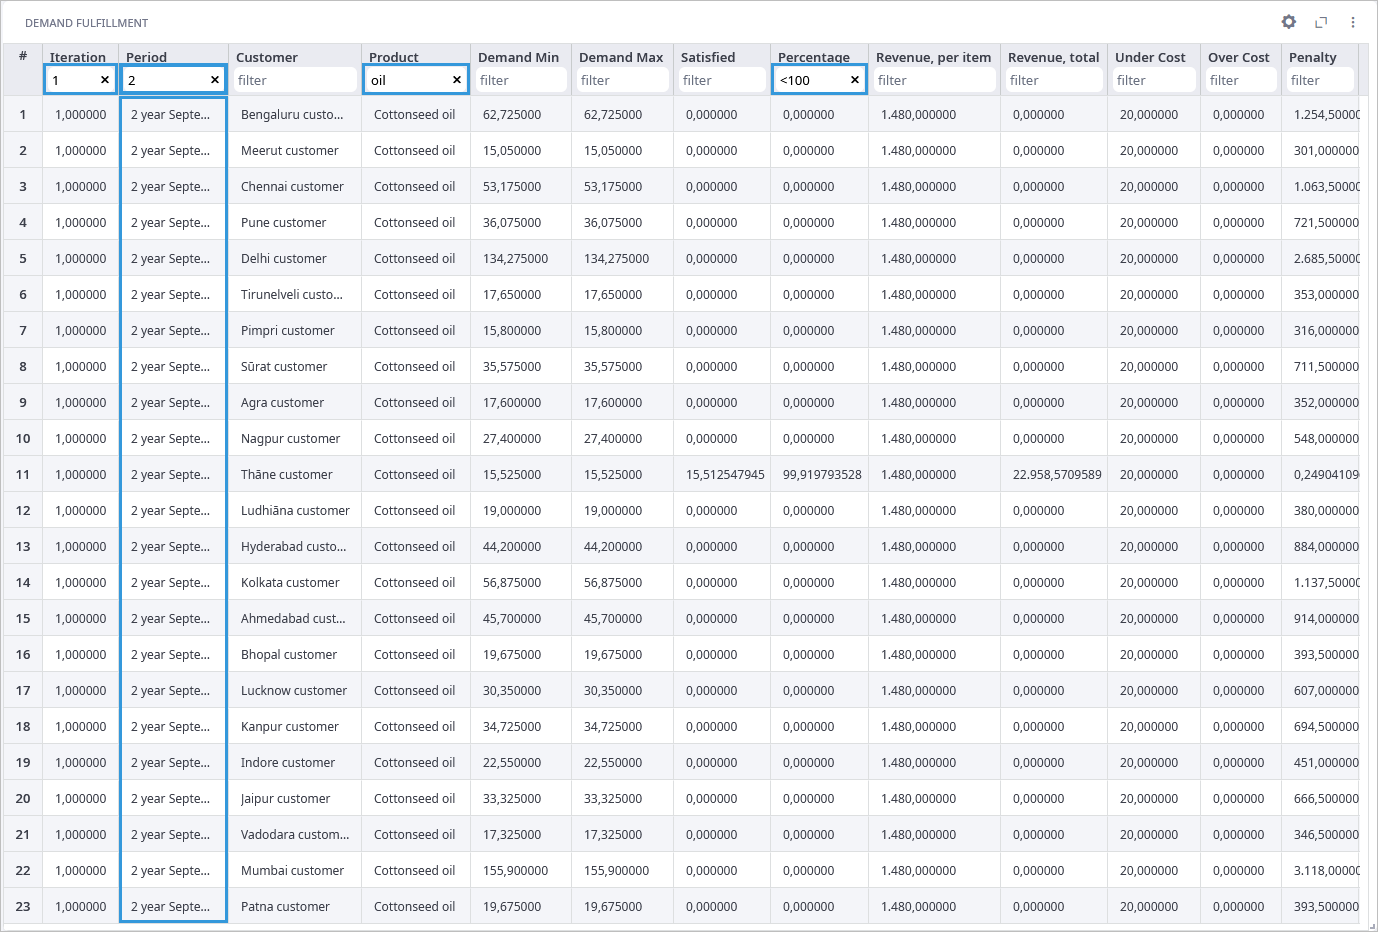
- During the second year demand for oil increased in September.
Part of the demand in this month was not satisfied.
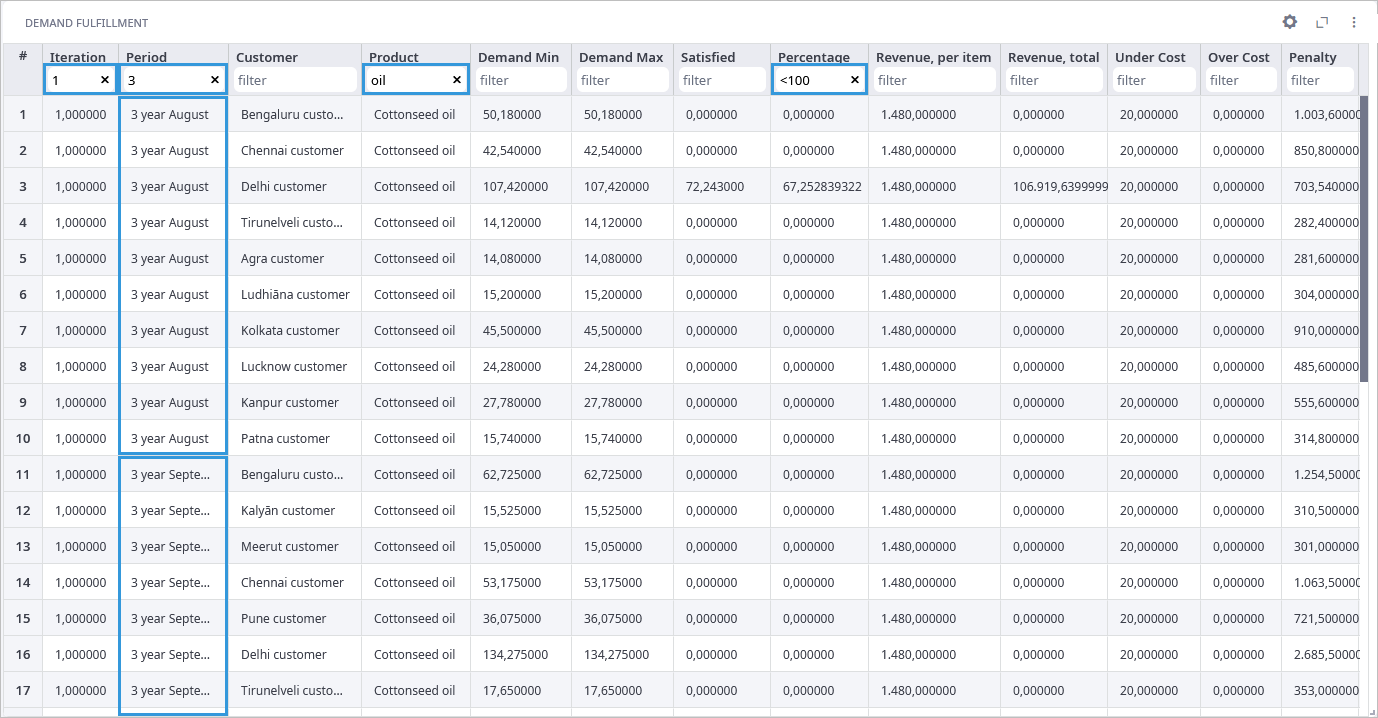
- During the third year the level of satisfied demand decreased and remained low from August to September.
But the amount of penalty for the by-products dropped because of the decrease in demand for the cottonseed meal.
-
How can we improve this article?
-